Sometimes it is necessary to check the performance of applications at function level, in order to see what are the functions that consume the most time during program execution. I’m going to go through two methods of profiling and exploring the results in a graphical manner.
Profiling using gprof
Detailed documentation on gprof can be found here https://ftp.gnu.org/old-gnu/Manuals/gprof-2.9.1/html_chapter/gprof_toc.html.
Let’s see below how we can extract profiling data from a process.
First, some additional compiler flags that we will need to add to the build scripts:
-pg -g -O0 -Wl,--no-as-needed
After rebuilding the program with the flags above enabled, run it once and it will generate a gmon.out file in the same folder as the executable. From this file, readable profiling data can be generated using the following command (assuming we are in the same directory as the gmon.out file):
gprof <executable> > profiling.log
The profiling.log file will have the format and can be interpreted as detailed here:
https://ftp.gnu.org/old-gnu/Manuals/gprof-2.9.1/html_chapter/gprof_5.html
To get a visual representation of the profiling data, one option can be https://github.com/jrfonseca/gprof2dot
The command line to get a visual representation is:
gprof <executable> | gprof2dot | dot -Tpng -o output.png
If the profiling data is too big, it may happen that the png format cannot handle the resolutions. In this case, one should switch to the svg format for the visual representation container. The command line would look like:
gprof <executable> | gprof2dot | dot -Tsvg -o output.svg
A sample output for the visualization tool would look like this:
The sample output looks all red because the execution time is too small. For a fully useful output, check the gprof2dot page.
The output shows how many times a function was called and what percentage of the total program execution time it used.
Profiling using Valgrind/Callgrind
Valgrind is usually used for memory profiling, but call profiling can be used for some performance testing, by using the callgrind tool in the valgrind package. Visualizing the results can be done using kcachegrind.
Installing callgrind/kcachegrind:
sudo apt-get install valgrind kcachegrind graphviz
Running callgrind on an executable:
valgrind --tool=callgrind --callgrind-out-file=./callgrind.%p ./<executable>
After the run is finished, a file called callgrind.<executable_pid> will be available in the same directory with the executable. That file can then be analyzed using kcachegrind to see which functions took what time for execution.
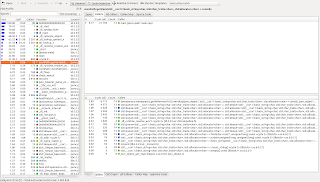
A kcachegrind output would look like this:
In the image above it is shown how much time each function has used, out of the total execution time.

